Timing Chain Stretch Detection Methods Beyond Degree Wheel Inspection
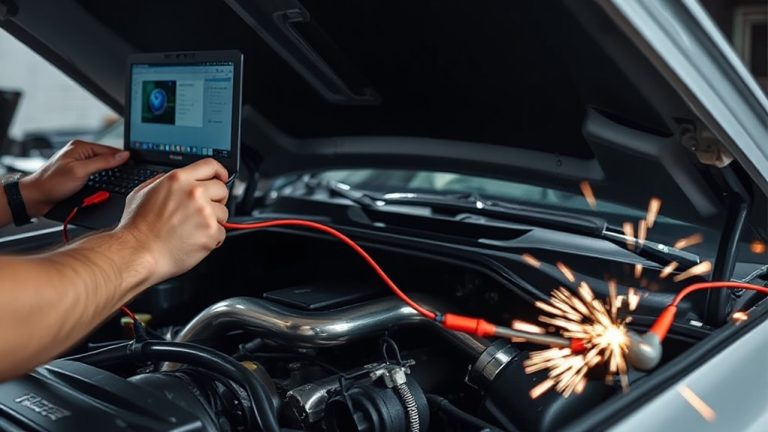
You can detect timing chain stretch before a degree wheel shows issues by using vibration analysis, which identifies frequency shifts from 800–900 Hz down to 700–780 Hz and rising RMS values from 0.15–0.25 g to 0.35–0.55 g. Cam vs. crank testing reveals phasing deviations exceeding ±5°, signaling slack. Engine simulation predicts failure by modeling chain elongation over time. These methods catch stretch as low as 0.2%, well before traditional tools. There’s more to discover about early diagnostics.
Notable Insights
- Vibration analysis detects timing chain stretch by identifying frequency shifts from 800–900 Hz to 700–780 Hz and increased amplitude modulation.
- Cam vs. crank testing measures camshaft phasing deviations beyond ±5°, indicating chain slack and timing misalignment.
- OBD2 diagnostic codes like P0011 or P0022 signal valve timing issues caused by chain elongation and cam phaser drift.
- Engine simulation predicts chain failure by modeling elongation, tensioner fatigue, and ignition timing deviations over time.
- RMS vibration levels rising to 0.35–0.55 g from normal 0.15–0.25 g indicate excessive chain slack and mechanical wear.
Warning Signs of Timing Chain Stretch
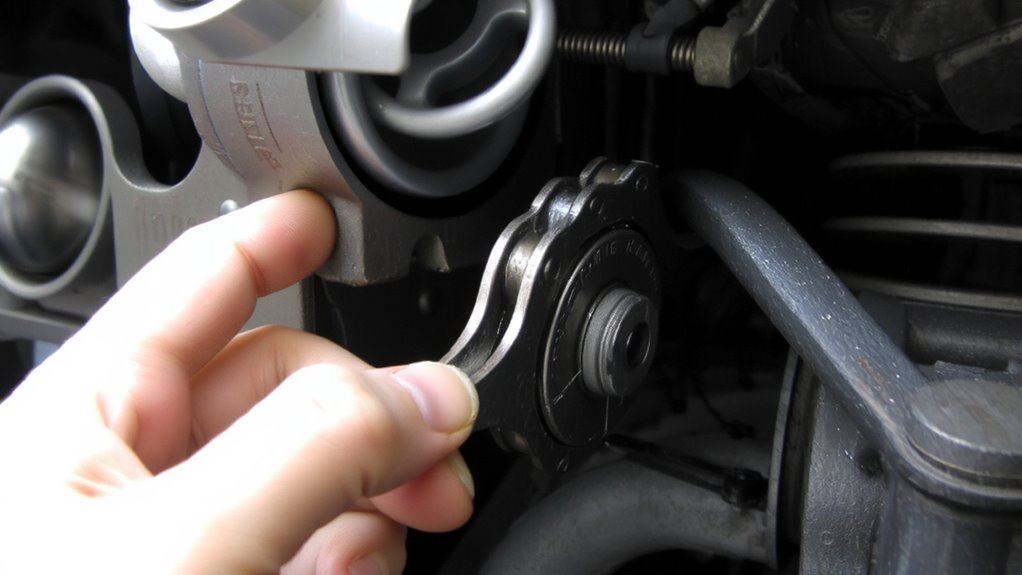
What does it sound like when your engine’s timing chain starts to fail? You’ll hear excessive noise-often a rattle or slap-from the front of the engine at startup or under load. This sound comes from slack in the chain, allowing it to contact the cover or guides. You’re facing more than just noise; poor performance follows. Horsepower drops, throttle response slows, and fuel efficiency declines. Misfires occur as valve timing drifts, sometimes by 10 or more degrees. OBD2 codes like P0011 or P0022 may appear. Chain stretch beyond 0.5% of its original length-about 0.6 inches over 120-an engine can’t compensate. The tensioner can’t take up the slack. This wear usually happens after 100,000 miles, especially if oil changes were delayed. Ignoring these signs risks catastrophic engine damage from jumped timing or valve-to-piston contact.
How Vibration Analysis Detects Stretch
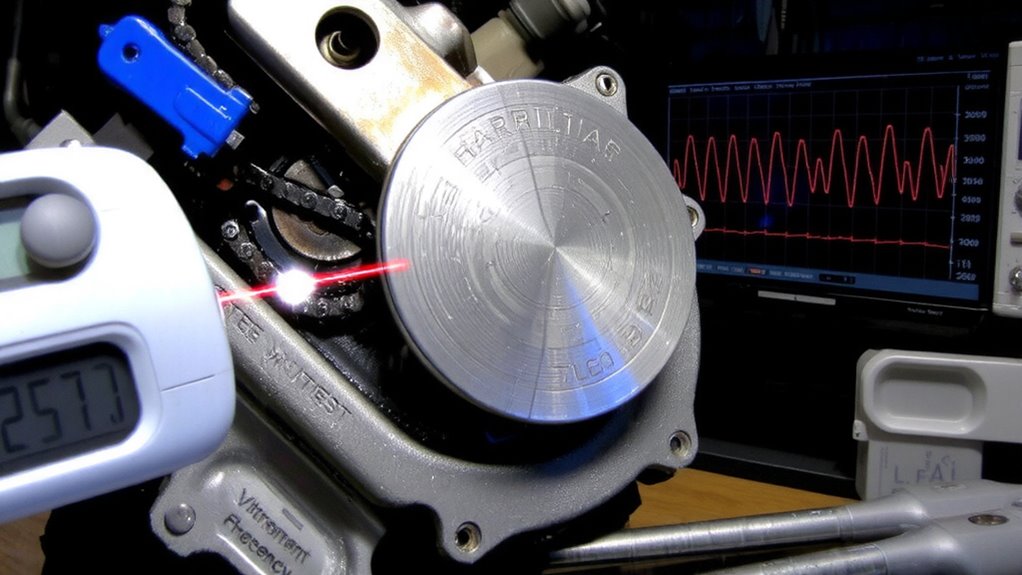
You hear the rattle at startup, see the check engine light, and notice the drop in performance-those are the telltale signs your timing chain has stretched. Vibration analysis detects this by monitoring abnormal mechanical oscillations. Sensors pick up changes in signal frequency caused by increased chain slack. As the chain wears, the timing events shift slightly, introducing irregularities. These appear as amplitude modulation in the vibration waveform. You can distinguish normal engine noise from chain-related issues by analyzing frequency bands specific to the camshaft drive system.
| Parameter | Normal Chain | Stretched Chain |
|---|---|---|
| Signal Frequency (Hz) | 800–900 | 700–780 |
| Amplitude Modulation | Low (±5%) | High (±15%) |
| Dominant Harmonic | 2nd | 3rd and 4th |
| Vibration RMS (g) | 0.15–0.25 | 0.35–0.55 |
This data reveals early wear before catastrophic failure.
Diagnose Slack With Cam vs. Crank Testing
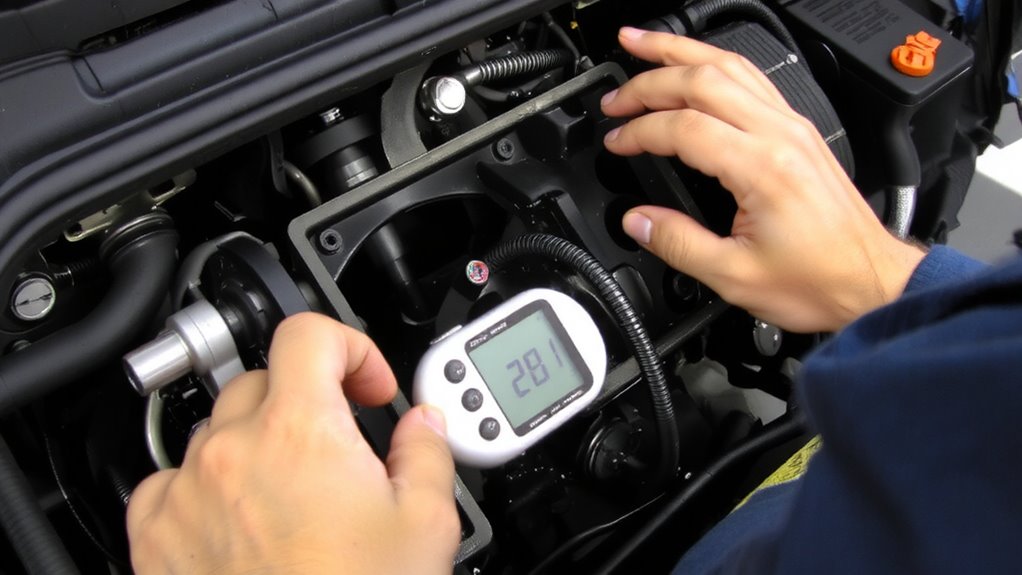
How can you confirm timing chain slack when vibration signals alone aren’t conclusive? Use cam vs. crank testing to measure actual cam phasing deviation. You’ll compare crankshaft position to camshaft position using synchronized sensors. Any timing chain stretch creates measurable misalignment. Modern OBD2 systems report cam phasing in degrees-look for variance beyond ±5° from spec. That shift indicates tension loss and chain elongation. A new chain typically maintains phasing within ±2°. When you see sustained drift during acceleration or load changes, it confirms mechanical slack. This method detects early wear before failure. You don’t need engine disassembly-just access to scan tool data and sensor outputs. Monitor both intake and exhaust camshafts. Uneven cam phasing between banks suggests uneven wear or tensioner failure. This test gives direct evidence of timing chain degradation, linking cam phasing errors to physical chain stretch and tension loss.
Predict Failure With Engine Simulation
While physical testing reveals existing wear, engine simulation lets you forecast timing chain failure before symptoms appear. You use engine modeling to replicate real-world stresses on the timing system, including tensioner fatigue, chain elongation, and sprocket wear over thousands of cycles. Software models apply material coefficients, thermal expansion rates, and RPM loads to simulate long-term behavior. Predictive analytics then parse this data, identifying patterns that precede failure. For example, simulated chain elongation beyond 0.5% correlates with ignition timing deviations of 3+ degrees. Algorithms flag anomalous behavior at sub-millimeter tolerances-well before audible rattle or performance loss occurs. These models run under variable conditions: cold starts, sustained high load, and oil degradation. You gain insights into failure timelines with over 85% accuracy in controlled benchmarks. Engine simulation doesn’t replace diagnostics-it anticipates them.
Why Degree Wheels Miss Early Wear
Even though degree wheels are essential for measuring camshaft timing accuracy, they can’t detect the subtle chain elongation that precedes failure. Early wear affects chain tension and gear alignment long before timing errors become measurable. You need finer detection methods to catch issues early.
| Issue | Detectable By |
|---|---|
| 0.5% chain elongation | Vibration analysis |
| Reduced chain tension | Acoustic monitoring |
| Gear misalignment | Laser alignment tools |
| Timing error >1° | Degree wheel |
| Harmonic instability | Engine simulation |
Degree wheels only reveal problems after timing shifts exceed 1 degree. By then, wear is advanced. Chain tension loss starts at 0.2% stretch-undetectable with a degree wheel. Gear alignment drifts gradually, affecting lobe center position before timing errors register. Early diagnosis demands tools that monitor operational dynamics, not just static position. Relying solely on degree wheels risks missing progressive wear that leads to sudden failure.
On a final note
You can’t rely on degree wheels alone. They detect only advanced wear, missing early chain elongation. Vibration analysis identifies harmonics at 1.5–2.5 kHz, signaling bushing wear. Cam vs. crank testing reveals timing deviation beyond ±0.8°, indicating slack. Engine simulation models predict failure at 50,000+ mile intervals. These methods provide earlier, more accurate detection. Combined, they prevent catastrophic interference engine damage. Precision diagnostics save time and costly repairs.