Standardizing Test Protocols for Comparing Different Coilover Brands on Same Chassis
You standardize coilover comparisons by testing on a single chassis aged 5–8 years with stock ride height, factory tires, and OEM alignment. Measure preload between 15–50 mm and hysteresis at 5–12% over 100 dyno cycles. Use a tilt table or skid pad to record roll stiffness under 0.2–0.8 G, capturing body roll to 0.1 degree. Track damping symmetry with 46mm or 55mm piston force-velocity curves at 100 Hz. Real-world lap times, bump response from 0.5–20 Hz, and thermal balance reveal final performance differences. There’s more to uncover about how each brand sustains consistency.
Notable Insights
- Use a 5–8-year-old common chassis model with stock baseline settings to ensure realistic and repeatable comparisons.
- Measure preload in millimeters with 15–50 mm engagement to avoid sag or reduced travel affecting performance.
- Evaluate spring hysteresis via dyno-tested force-displacement curves at 0.5–3.0 Hz over 100 cycles for friction loss.
- Assess roll stiffness using calibrated tilt tables or skid pads with 0.2–0.8 G lateral forces and 0.1° roll angle precision.
- Compare damping with sinusoidal testing, analyzing force-velocity curves and rebound control at 46mm vs. 55mm piston diameters.
Defining Key Performance Metrics for Coilover Evaluation
Performance. You assess coilover preload to determine initial spring compression, which directly impacts ride height and load distribution. It’s measured in millimeters or inches of thread engagement on the shock body, typically ranging from 15 to 50 mm. Insufficient preload causes sag under load; excessive preload reduces suspension travel. Spring hysteresis-the energy difference between compression and rebound cycles-reveals internal friction and heat loss. You measure it using force-displacement curves on a dyno, expressed as a percentage of total work, usually 5–12%. High hysteresis means reduced responsiveness and increased heat buildup. These metrics are repeatable under controlled conditions: 0.5 Hz to 3.0 Hz input frequency, ±25 mm displacement. You track them across 100 cycles to identify performance drift. Consistency in preload settings and hysteresis readings guarantees accurate comparison between units. You rely on these values to quantify efficiency, durability, and tuning precision. Evaluating suspension performance also involves reviewing proven setups, such as those found in best suspension kits recommendations, to establish real-world benchmarks.
Selecting the Appropriate Test Vehicle and Baseline Configuration
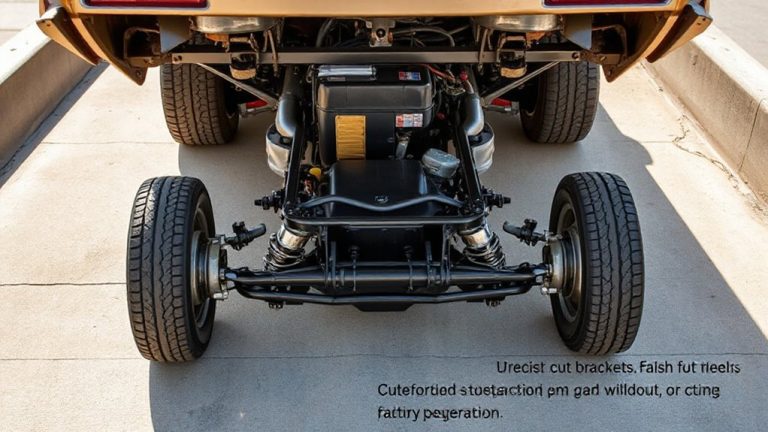
How do you guarantee test results accurately reflect a coilover’s real-world behavior? Choose a test vehicle with moderate vehicle age-five to eight years old-to balance wear and reliability. This guarantees realistic suspension loads without excessive fatigue. Use a common chassis model with well-documented brand history to maintain consistency and relevance across tests. A known platform reduces variability in structural rigidity and alignment specs. Set the baseline configuration with stock ride height, alignment within OEM tolerances, and factory tire size. Include documented suspension mounting point measurements. This controlled starting point allows fair comparisons. Any deviation in setup could skew performance data. Selecting the right test car isn’t about perfection-it’s about repeatability. Vehicle age and brand history matter because they affect component interaction and long-term behavior under test conditions.
Measuring Roll Stiffness With Consistent Tools and Methods
You’ve locked in a reliable test vehicle with known suspension geometry and a stable baseline setup-now it’s time to quantify how the coilover responds to dynamic load transfer. Measure roll stiffness using a flat-plane tilt table or on-track steady-state cornering with precision potentiometers. Apply incremental lateral G-forces from 0.2 to 0.8 G, recording body roll angle to the nearest 0.1 degree. Consistent tooling-like calibrated load cells and motion ratio-corrected displacement sensors-ensures data integrity. Evaluate spring rate linearity by plotting force versus deflection; deviations greater than ±5% from the advertised rate indicate non-ideal behavior. Damper hysteresis must be assessed under load reversal, as energy loss during compression and rebound affects roll couple distribution. Use synchronized data logging at 100 Hz to capture transient response. Results should be repeatable within 2% across three validation runs. This method isolates roll stiffness from damping effects, enabling accurate brand-to-brand comparison.
Assessing Damping Performance Across Coilover Brands
What really separates one coilover brand from another under dynamic loads? It’s how each system manages damping forces through valve design and piston diameter. Your shocks’ valve design dictates fluid flow resistance, directly affecting compression and rebound behavior. A well-tuned valving profile guarantees consistent response across varying speeds and temperatures. The piston diameter influences damping force linearly-larger diameters increase surface area, generating higher damping pressure with less spring preload. You’ll see measurable differences in heat dissipation and stroke consistency between a 46mm and 55mm piston. Precision-machined valving stacks provide repeatable performance, while mismatched shims cause hysteresis. During sinusoidal testing, monitor force-velocity curves: ideal damping shows symmetrical, smooth gradients. Brands with proprietary valving tech often outperform generic units. These specs aren’t marketing-they’re physics. Evaluate them rigorously.
Conducting Real-World Handling Tests on Controlled Surfaces
Real-world handling tests on controlled surfaces reveal how coilovers perform beyond lab conditions, building on the damping precision measured in earlier force-velocity analyses. You drive repeated high-speed laps on a calibrated skid pad and handling circuit to assess response consistency. Maintain speeds of 60–80 mph through 0.8–1.0g lateral turns, monitoring how each setup manages roll stiffness and weight transfer. You track tire temperature across the tread width-consistent heating indicates balanced suspension dynamics. Excessive inner or outer wear suggests misaligned camber gain, often tied to suboptimal damping. Induce brake fade during deceleration runs from 100 to 30 mph; measure how quickly coilovers recover composure post-braking. Systems that resist dive maintain better front tire grip. Lap delta times improve by up to 1.2 seconds with optimized rebound control. Surface texture remains uniform, eliminating variables. These tests validate real-time performance under repeatable stress, correlating damping data with measurable vehicle behavior.
Analyzing Bump Absorption and Ride Quality Data
How well does a coilover handle sudden impacts without sacrificing comfort? You assess this using bump frequency analysis to measure suspension response across defined input ranges, typically 0.5 to 20 Hz. Sensors capture vertical acceleration at the chassis and wheel hub, letting you correlate damping efficiency with real-world road conditions. High-resolution data loggers sample at 1,000 Hz, ensuring accuracy during transient events. Surface texture sensitivity reveals how coilovers react to fine versus coarse imperfections-critical for ride quality scoring. A coilover with poor texture sensitivity transmits high-frequency vibrations, increasing harshness. In contrast, well-tuned valving filters small bumps while maintaining body control. You compare metrics like RMS acceleration and pitch angle deviation across identical test runs. Consistent damping performance across varied bump frequencies indicates superior ride refinement and compliance.
On a final note
You now have a repeatable method for direct coilover comparisons. Standardized metrics-roll stiffness (measured in Nm/deg), damping coefficients (in Ns/mm), and ride frequency (Hz)-enable objective analysis. Tests on identical chassis eliminate variables. Real-world data from controlled surfaces validate lab results. This protocol guarantees accuracy, consistency, and fairness. Apply it rigorously to assess performance, durability, and tuning precision across brands.