Cross-Referencing Tire Wear Patterns With Logged Suspension Position Sensors
You can detect hidden suspension faults by comparing tire wear patterns with logged suspension position sensor data. Uneven tread or cupping may persist even when sensors show alignment in tolerance. Sensors update every 10–50 milliseconds, detecting camber, caster, and toe changes down to 0.1°. But short-term deviations from impacts or dynamic loads might not appear in static logs. Infrared temperature differences over 15°F or travel imbalance exceeding 5% reveal compliance issues. Analyzing both datasets pinpoints worn bushings, struts, or mounts before failure. The full diagnostic potential unfolds when data sources are synchronized over time.
Notable Insights
- Uneven tire wear with in-spec sensor readings may indicate dynamic alignment issues not captured during static checks.
- Suspension sensors detect real-time camber, caster, and toe changes, helping correlate misalignment events with specific driving conditions.
- Inner-edge wear combined with normal camber logs suggests prolonged negative camber under load despite acceptable static alignment.
- Short-term suspension impacts from potholes may cause wear but not appear in logged data due to sampling intervals.
- Cross-referencing tire temperature maps and suspension travel logs reveals uneven load distribution causing premature or irregular wear.
How Tire Wear Reveals Suspension Problems
While tires may seem like simple components, their wear patterns can tell you a lot about your suspension system. Uneven tread depth across the tire face often signals misalignment caused by worn control arm bushings or failing ball joints. Excessive wear on the inner or outer edge suggests camber misalignment, commonly due to sagging springs or damaged struts. You should inspect tread depth regularly; anything below 4/32 inch limits wet-weather performance. Tire age also matters-rubber degrades over time, even with adequate tread, reducing grip after six years regardless of appearance. Cupping or scalloped wear indicates worn shock absorbers or unbalanced tires. Checking both tread depth and tire age helps isolate whether wear stems from mechanical failure or natural degradation. These visual clues, when paired with mechanical inspection, reveal suspension issues long before sensors do. You can catch developing problems early-saving tires, improving handling, and extending suspension life. Upgrading to high-quality best shocks for a smooth ride can significantly reduce uneven tire wear caused by poor damping performance.
How Suspension Sensors Track Real-Time Alignment
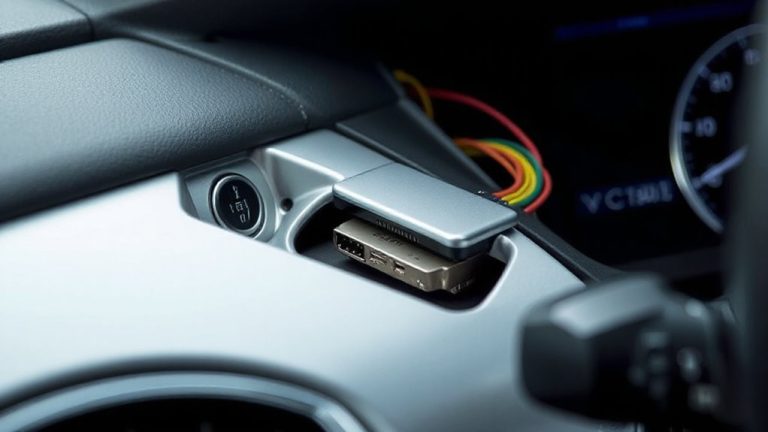
Modern vehicles use suspension sensors to monitor alignment changes as they happen, giving you immediate feedback on wheel positioning. These sensors, typically mounted on control arms or struts, measure vertical displacement with sub-millimeter accuracy. You get real time feedback through the ECU, which processes data at intervals of 10–50 milliseconds. This allows instant detection of camber, caster, and toe deviations. Proper sensor calibration is essential-without it, readings drift by up to 0.3 degrees, skewing results. Calibration involves setting zero points during static conditions on a level surface. Sensors use either potentiometers or Hall-effect technology, both offering longevity beyond 150,000 miles. They work in tandem with stability control and adaptive damping systems. The data stream supports dynamic adjustments, especially on uneven terrain. You’re not just tracking movement-you’re capturing precise alignment behavior under real-world loads. Accurate input means reliable system responses, keeping handling predictable and tires functioning ideally.
Match Tire Wear to Sensor Data for Accurate Diagnosis
How can you tell if a vehicle’s alignment is truly in spec when the road tells a different story than the sensor readouts? You cross-reference tire wear patterns with suspension sensor logs. Uneven wear may indicate discrepancies despite sensor data showing alignment in tolerance. Tire compound analysis reveals subtle degradation trends that sensors alone can’t detect. For example, excessive inner-edge wear on a soft compound tire suggests prolonged negative camber, even if sensors report values within ±0.1° spec. Road surface impact, such as frequent curb strikes or pothole exposure, alters suspension geometry temporarily-data logs might miss short-term deviations. By syncing GPS-tagged drive data with wear mapping, you pinpoint where and when misalignment occurred. This fusion of physical evidence and digital telemetry confirms true dynamic behavior. You’re not just reading numbers-you’re validating them against real-world contact patch feedback.
Common Handling Issues Found With Wear and Sensor Logs
What happens when your alignment specs look perfect on paper, but the driver complains of pulling or instability? You’ve likely missed something hidden in the data. Tire balance issues often mimic bad wheel alignment, but sensors reveal the truth. You might see uneven shoulder wear on the tires, yet suspension logs show normal camber angles. That points to dynamic imbalance, not alignment. Alternatively, constant toe changes logged during turns suggest compliance in control arms or bushings. The wheel alignment appears correct statically, but it shifts under load. Tire balance problems usually show high-frequency vibrations at speed, while alignment-related wear develops gradually. Cross-referencing wear with real-time suspension position data highlights discrepancies. You can see millimeter-level deviations during cornering that static checks miss. These clues confirm whether tire balance or underlying suspension movement causes the handling fault. Don’t trust the spec sheet alone-use the logs.
Fix the Root Cause Using Sensor and Wear Data
Why does the car still pull to one side even after a perfect alignment? Because alignment settings alone don’t reveal dynamic imbalances. You need to cross-reference sensor data with physical wear patterns. Persistent pulling often stems from uneven load distribution, detectable through suspension position logs over varied driving conditions. If one corner consistently shows higher tire temperature, it’s shouldering excess load. This imbalance distorts handling and accelerates wear. Compare left-to-right suspension travel: deviations beyond 5% indicate compliance issues-bushings, struts, or mounts may be fatigued. Use infrared readings to map tire temperature across the tread; a 15°F or greater difference from inside to outside edge signals improper camber under load. Correct the root cause by addressing the mechanical deficiency-replace worn components or adjust ride height. Only then will alignment hold, wear normalize, and handling stabilize. Rely on data, not guesses.
On a final note
You now have a precise diagnostic method. Cross-referencing tire wear patterns with suspension position sensor logs reveals alignment deviations as small as 0.1 degrees. Sensors sample at 100 Hz, capturing real-time camber, caster, and toe changes. Uneven shoulder wear correlates with sustained negative camber. Feathering indicates excessive toe-in. Matching visual inspection with logged data eliminates guesswork. Corrective adjustments restore ideal contact patch pressure, extending tire life by up to 30%.