Supercharger Bypass Actuator Diagnostics Using Scan Tool Feedback Loops
You can diagnose supercharger bypass actuator issues using scan tool feedback loops by monitoring real-time position and PWM duty cycle. A healthy actuator responds within 100–150 milliseconds, with less than 5% hysteresis. Watch for lag, inconsistent movement, or deviation greater than 10% from the 0.25–0.35 inch stroke range. Compare commanded vs. actual position; no change suggests mechanical failure. Check solenoid resistance (22–30 ohms) and vacuum integrity. Live data reveals faults before symptoms occur-further analysis strengthens accuracy.
Notable Insights
- Use a scan tool to monitor actuator position and PWM duty cycle for discrepancies between commanded and actual values.
- Compare real-time boost pressure with commanded levels to identify mechanical faults affecting supercharger performance.
- Check response time; healthy actuators adjust within 100–150 milliseconds of a load change.
- Verify electrical signals, including solenoid resistance (22–30 ohms) and reference voltage (4.8–5.2V), to rule out electrical faults.
- Post-repair, confirm linear actuator movement with less than 2% variance and intact wiring for reliable feedback loop operation.
How a Failing Bypass Actuator Affects Engine Performance
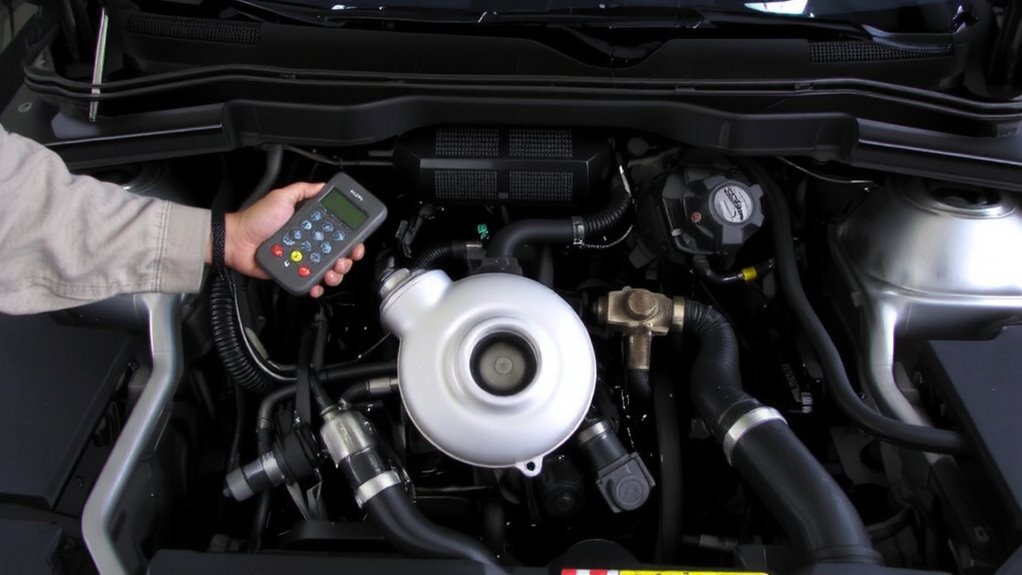
When your supercharger bypass actuator starts to fail, you’ll likely notice a drop in engine responsiveness and inconsistent boost pressure. Mechanical wear inside the actuator can restrict its movement, preventing proper opening and closing of the bypass valve. This leads to delayed throttle response and erratic supercharger engagement. Vacuum leaks in the actuator’s diaphragm or supply lines further degrade performance by disrupting the pressure signal that controls valve operation. You might see boost fluctuations of ±2 psi or more under steady throttle. Stuck-open conditions cause excessive parasitic loss, reducing efficiency. Stuck-closed scenarios result in over-boosting, risking engine damage. Typical actuator stroke range is 0.25 to 0.35 inches; deviations beyond 10% indicate failure. Use a vacuum pump to test diaphragm integrity-hold 18 inHg for 30 seconds. Any drop suggests internal leakage. These failures directly impact air delivery and combustion efficiency, degrading overall engine output.
See Real-Time Actuator Response During Load Changes
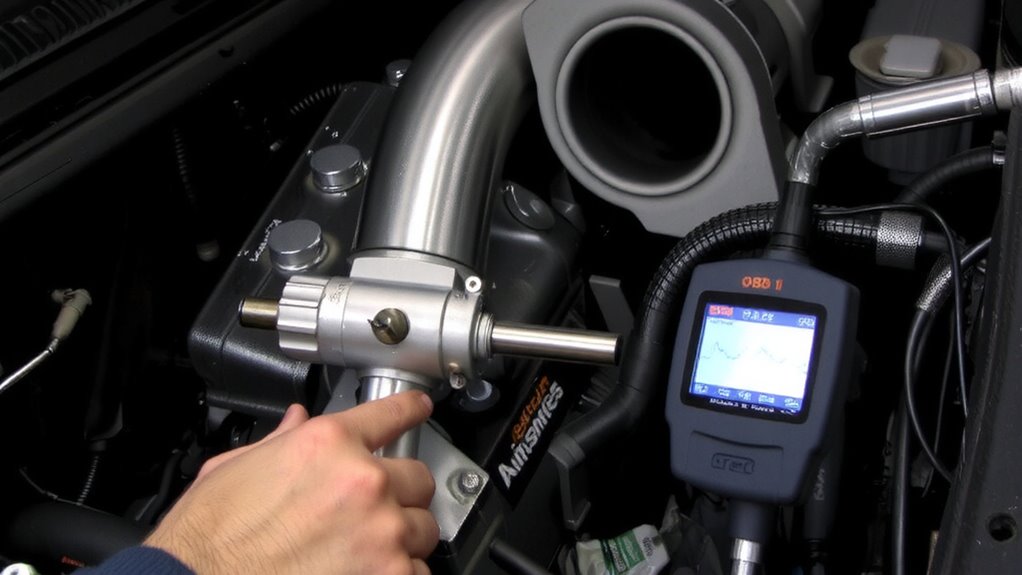
Why wait for symptoms when you can watch the actuator respond in real time? With live data, you see exactly how the bypass actuator reacts during throttle changes. A healthy actuator adjusts within 100–150 milliseconds of a load shift. Any longer, and you’ve got response lag, which disrupts boost control. Monitor the feedback loop as you increase engine load-the actuator should move smoothly, without hesitation. If it hesitates or jumps, that indicates actuator hysteresis, where the output doesn’t match the command due to internal friction or wear. Hysteresis over 5% of total travel suggests mechanical degradation. You’re not just reading codes-you’re watching system dynamics. Real-time feedback turns guesswork into diagnosis. You detect subtle lag before it becomes a driveability issue. This is precision diagnostics: seeing degradation as it happens, not after the fact. For Duramax diesel applications, using a scan tool with deep OBD2 protocol support ensures accurate actuator data streaming.
Access Actuator Position and Duty Cycle With a Scan Tool
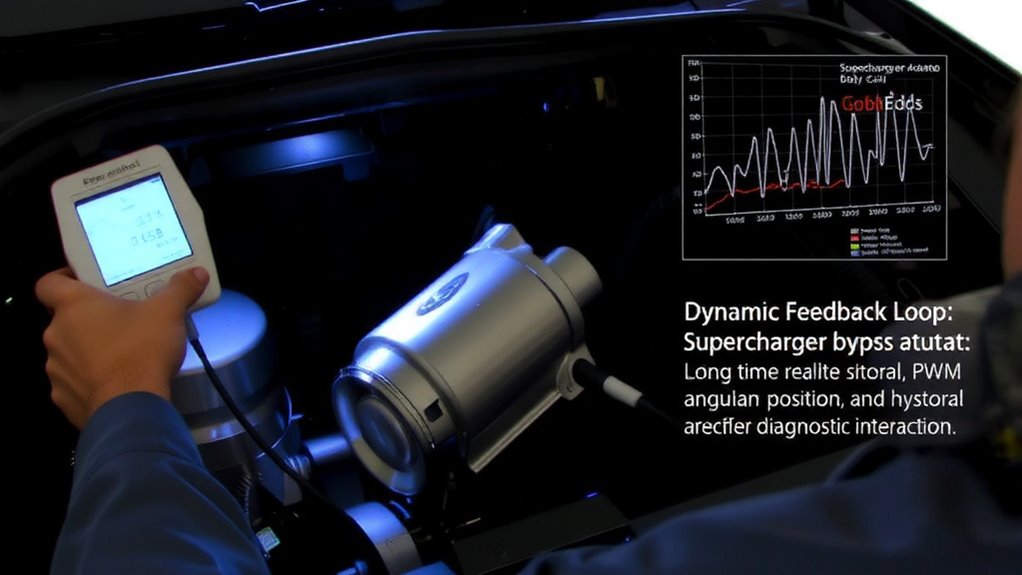
How do you know the bypass actuator is getting the command to move if you can’t see what the system is telling it? You access actuator position and duty cycle data through a scan tool. This allows real-time monitoring of commanded vs. actual movement. The scan tool displays position as a percentage-typically 0% (closed) to 100% (fully open)-and duty cycle as a PWM signal, usually ranging from 0% to 100%. You’ll see how close the actuator responds to duty cycle limits set by the PCM. If the signal stays within expected ranges but position doesn’t change, a mechanical fault is likely. Proper actuator calibration guarantees the system recognizes full closed and open positions. Without calibration, readings will be inaccurate. Always verify both values during idle and load. This data confirms whether the command is correct-and whether the actuator responds as designed. For accurate and reliable readings, consider using one of the best OBD2 scanners available on the market.
Diagnose Faults Using Boost Pressure Response Data
What if the turbo isn’t delivering the expected boost despite proper actuator commands? You need to analyze boost pressure response data in real time. Modern scan tools log actual boost versus commanded values, letting you spot pressure variance quickly. A consistent lag or drop indicates a mechanical issue downstream of the actuator. You’re still in control of boost control, but something’s disrupting airflow. Check for collapsed hoses, intake leaks, or stuck valves-common culprits. Use the scan tool’s graphing feature to overlay boost pressure and actuator duty cycle. If the signal matches command but pressure doesn’t respond, the fault isn’t electrical. Pressure variance under load suggests physical restrictions or turbo inefficiency. Don’t guess-validate flow. Think of it like water in a hose: even with full valve opening, kinks block output. Data doesn’t lie; use it to isolate faults beyond electronics. For accurate diagnostics on 6.0L Powerstroke systems, using a best scan tool for 60 Powerstroke ensures comprehensive access to critical feedback loops and live data streams.
Find Sticking, Solenoid, and Electrical Issues Quickly
Even when the boost pressure sensor reads correctly, poor response might stem from sticking, solenoid, or electrical faults in the actuator circuit. You can detect sticking by observing delayed or inconsistent actuator movement during commanded position changes. Mechanical wear in the valve shaft or bushings often causes binding, especially in high-cycle applications. Use the scan tool to command 50% actuator position-any deviation over 5% without movement suggests internal friction. Solenoid issues typically show as erratic duty cycle signals or failure to hold vacuum. Check for proper coil resistance; values outside 22–30 ohms indicate degradation. Electrical faults, including loose connectors or corroded pins, disrupt signal integrity and contribute to calibration drift. Periodically verify reference voltage (4.8–5.2V) and ground continuity. These steps isolate faults before deeper teardown, saving time and improving diagnostic accuracy.
Verify Fix With Live Supercharger Bypass Actuator Feedback
You’ve identified and addressed mechanical binding, solenoid faults, or electrical issues in the supercharger bypass actuator-now confirm the repair with live feedback monitoring. Connect your scan tool and observe real-time position data, typically displayed as a percentage or voltage between 0.5V (closed) and 4.5V (fully open). Command the actuator through its full range while watching for smooth, linear response. Any hesitation or stutter indicates potential signal interference or incomplete actuator calibration. Modern systems require precise feedback alignment; even minor deviations disrupt airflow control. Verify the duty cycle signal from the PCM matches commanded values-typically 0% to 100% PWM. Guarantee wiring shields are intact to prevent electromagnetic noise. Successful calibration shows repeatable movement with less than 2% variance. Consistent live data across multiple cycles confirms the fix.
On a final note
You diagnose supercharger bypass actuator issues efficiently using scan tool feedback loops. Real-time data reveals actuator position and duty cycle under load. You detect sticking, solenoid failures, or wiring faults by analyzing boost pressure response. A functional actuator adjusts within 200 milliseconds, maintaining ±1.5 psi of target boost. Post-repair, live feedback confirms actuator movement across 0–100% duty cycles, ensuring precise throttle response and peak supercharger efficiency.